te3:quick_stats
This is an old revision of the document!
Quick stats
Although TE offers numerous methods of organizing and customizing data for your trades (switching between menus, creating interfaces), the quantity of data displayed can still be hard to overview (especially if you have a large number of trades). “Quick stats” help you instantly survey specific statistical data for your trades.
They can be activated in the following menus: Overview, Hourly, Pages and Network.
Activate Quick stats
There are two basic methods to survey “Quick stats”. Navigate to the Overview menu and open them from:
- Toolbar:

Click on one of theQuick statsbuttons on your toolbar and display total summary stats (cumulative stats for Active trades, Feeders, Sellers and System trades).
- Quick stats drop-down menu:
Click on the
Multi taskicon for a desired trade in the “Action” column and open a “Quick stats drop-down menu” with a list of quick stats options for this trade.
Multi taskicon in the “Total summary” row will display total summary stats (same asQuick statsbuttons on your toolbar),}} Multi taskicons in section summary rows will display summary stats for sections (Active trades section, Inactive trades section, Feeder section and Seller section).
Available options
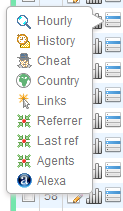

Hourly stats displayed in 24 rows, one for each hour. Current hour is marked with bolded text. Click
Customizebutton to open “Customize” stats window. There you can add/remove stats parameters (check boxthe ones you want to enable / disable), set a desired colour for each individual column (use the
Colorbutton) and change their order (useDragicon to drag them up and down and change column order). ClickUpdateto save your changes.
 }
}
History stats for the selected date range (last 30 days by default). To survey data for a different date range, specify it in theDate rangewindow and clickSubmit. Click Customize, to customize stats table. You can add / remove columns, change column color and column order. ClickUpdateto save your changes.
To survey history graph of the past 30 days, click
Graphbutton on the left side of “History stats” window. Choose betweenDaily graphandMonthly graph(with option to specifyDate range).

Qick stats iconCheatopens a Cheat logs window with a list of IPs that meet the criteria for cheating, sorted acording to ''Raw'', ''Clk TG'' or ''Prod TG''.

Quick statCountry statsallows you to monitorRaw,Clk TGandProd TGfor each individual country and survey graphs for desired trades.

Link report: find out which links your surfers are clicking the most. If you have addedl=nameparameter to your outgoing links, link report stats are being tracked automatically and you can view stats for each name (clicks and percents).
Learn more

Referrer logs: view the cumulative counts for Referrers (incoming) and Delivered URLs (outgoing).

Referrer productivity logs: is only available forFeeders(buyers) and system trades Unknown and Search Engines, because they send traffic from multiple sources (domains).
Read all about Referrer productivity.

Last referrer logs: view last Referrers (incoming) and last Delivered URLs (outgoing).

Qick stats iconSE keysopens the “Search engine Keywords” window and diplays a list ofKeywordssurfers used to navigate to your site, or a list ofSearch enginesthat referred surfers to your site.
SE keysicon is only available with the system trade Search engines.

Find out which user agents (browsers) your surfers are using.

Alexa global traffic rank: find out how the respective trade is ranked relative to all other sites on the web. Alexa global traffic rank is calculated from a site's estimated average of daily unique visitors and its estimated number of pageviews over the past 3 months, and is updated daily. Read more about Alexa.
te3/quick_stats.1416807578.txt.gz · Last modified: 2014/11/24 05:39 by moderator